

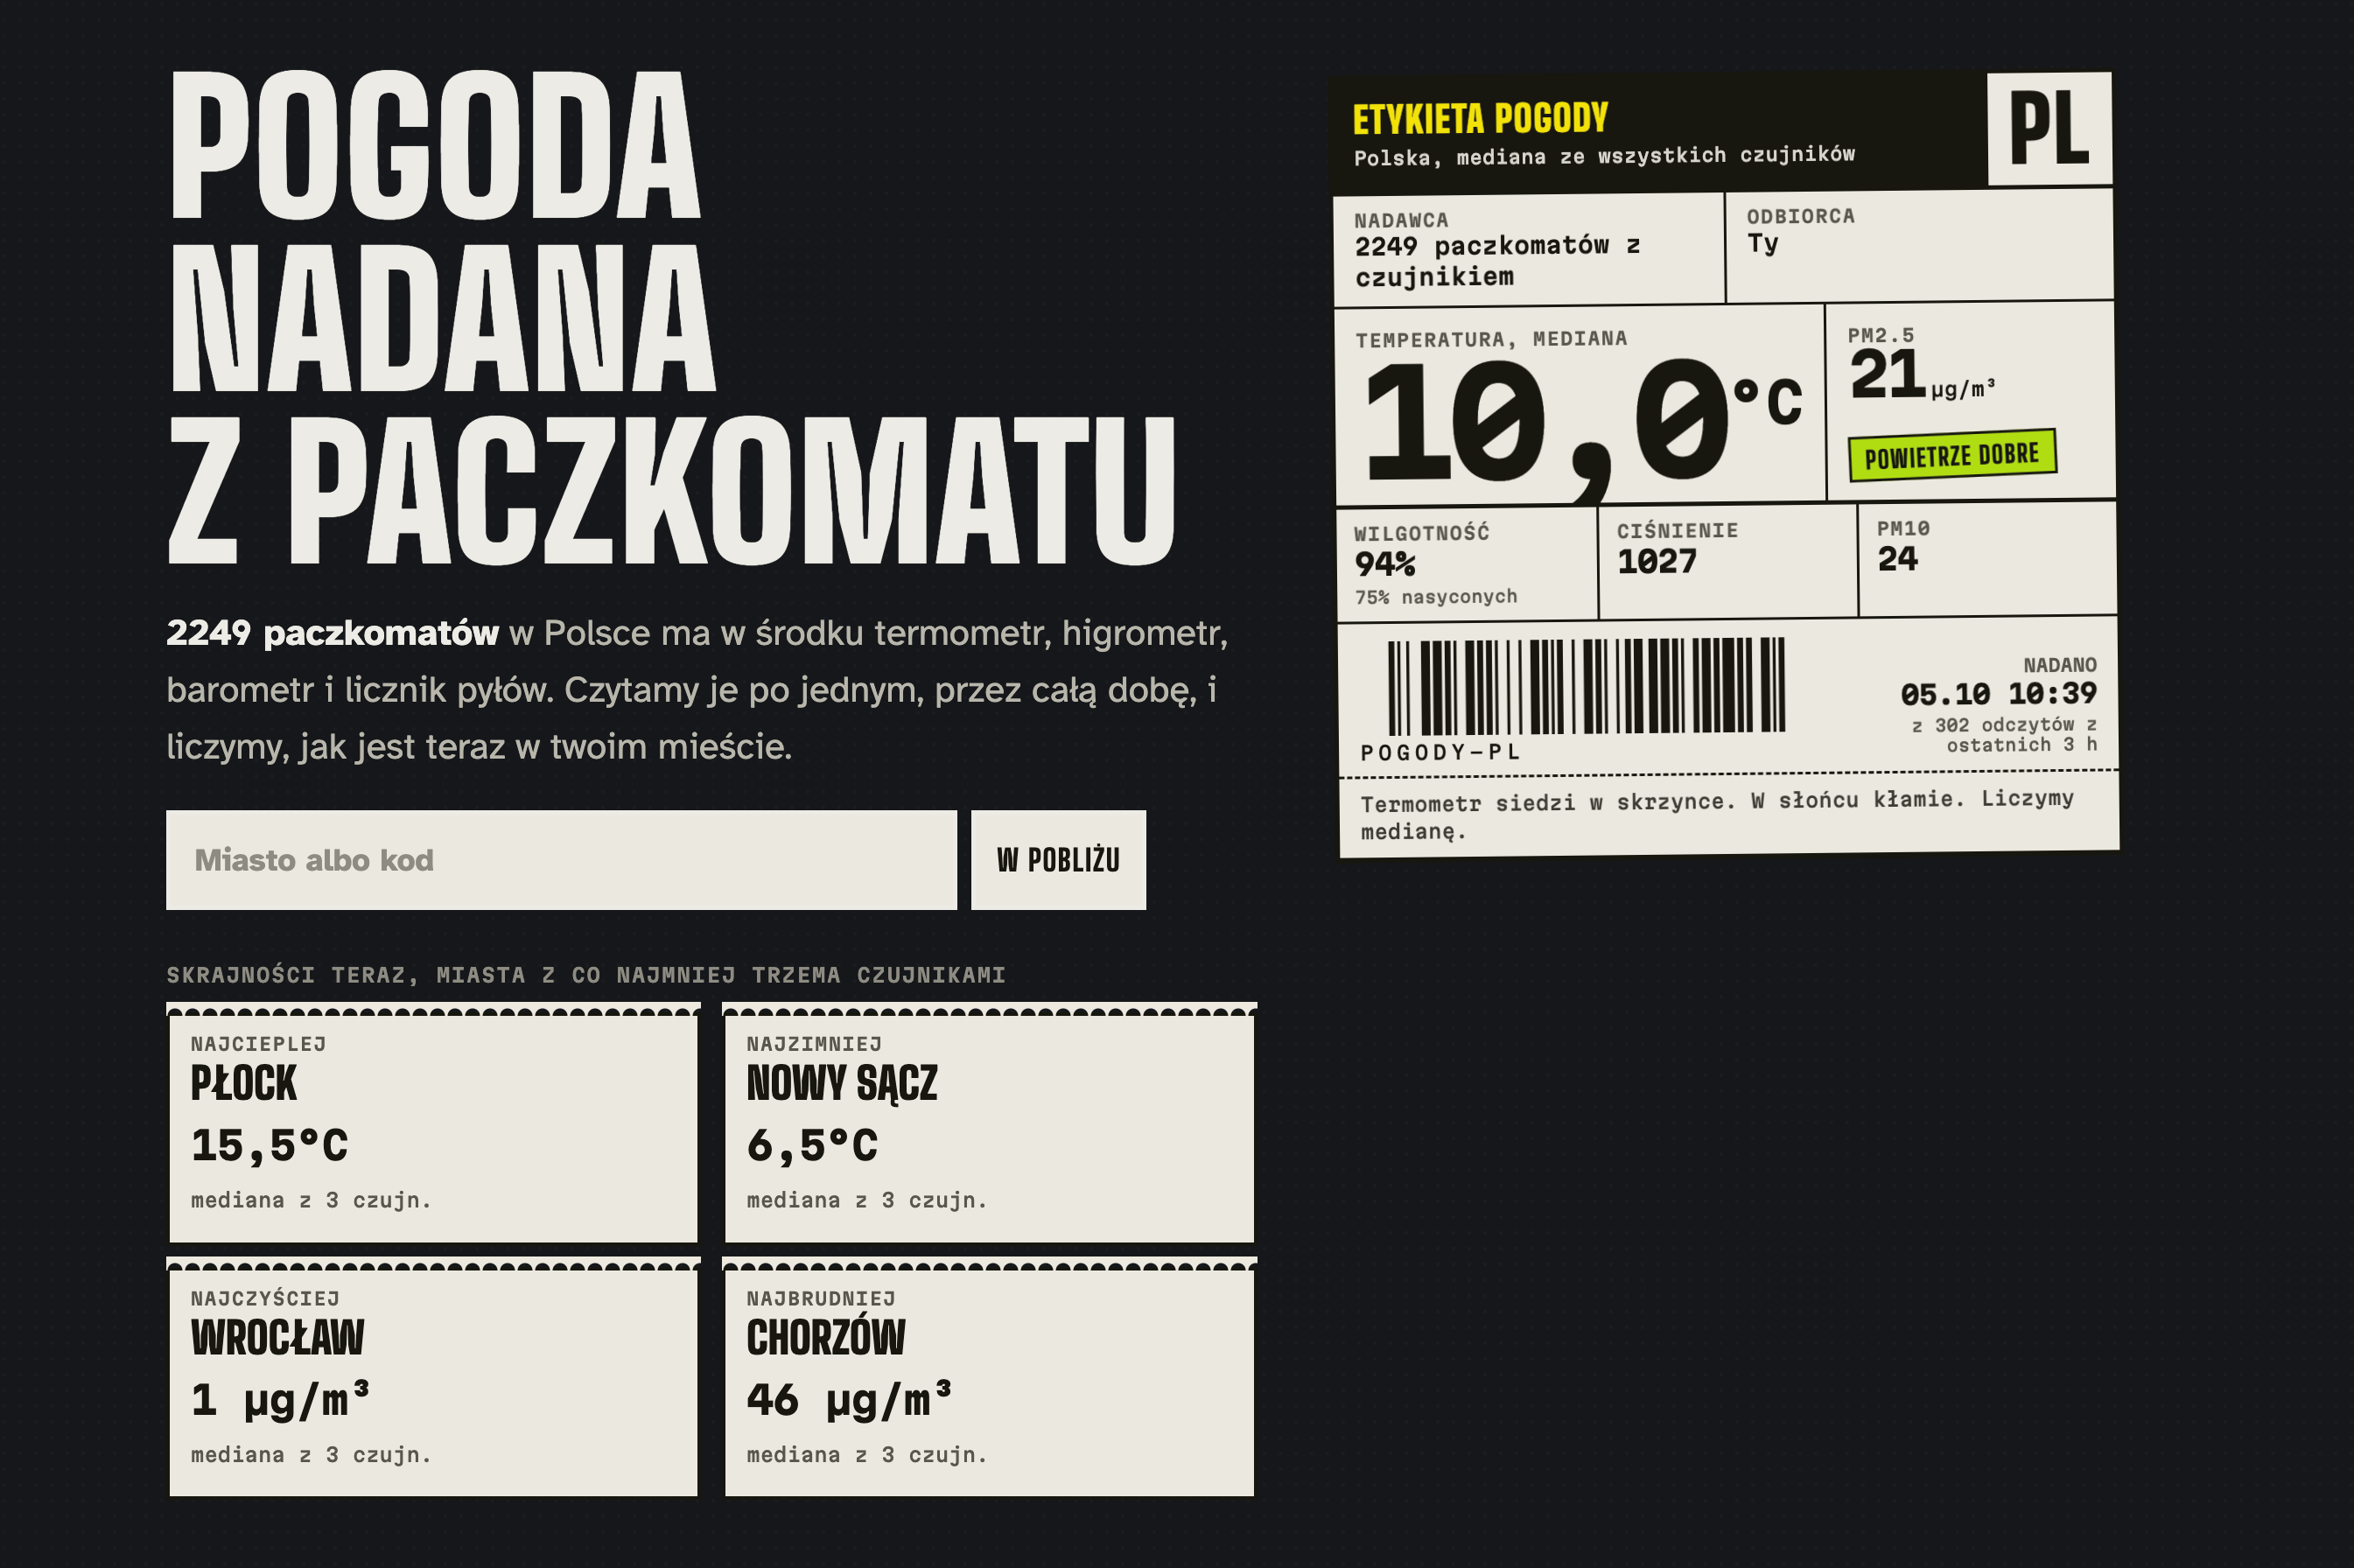
Jakub Mrugalski posted something small on LinkedIn. Some InPost parcel lockers have sensors inside them, and the readings are public.
Quick context if you don't live in Poland: a Paczkomat is an InPost parcel locker, a wall of little metal doors where you pick up your online orders with your phone. They are everywhere here, from supermarket parking lots to villages with one shop.
Jakub had no project in mind. He found out the data existed and shared it. I read his post and my first thought was: that's a weather map. Thousands of thermometers already standing on Polish pavements, mostly feeding one app.
So I gave Wiz, my AI agent, a short brief. Simple and useful. Built around cities, so you can check your own town in one glance. And a design that doesn't look like every other dashboard, because I knew other people would build on this data too.
About a day later, pogody.jock.pl was live. My idea and my direction, Wiz's execution. It's the sixth site in a small family of them, and I've never written about any of them. So this is that post.
A pivot on night one
The first sites shipped overnight on July 9. The starting idea was something else: track Polish politicians' asset declarations. Then it turned out jakglosuja.pl already does that, and does it well. A second one would add nothing.
So we pivoted. Same instinct, different target: public data that exists but isn't gathered anywhere in a readable way. That list turned out to be long.
Wiz is the AI agent I built. It lives on its own Mac Mini, and a lot of its building happens on night shifts while I sleep. These sites are a good example of how we split the work. I decide what's worth building, what it should feel like, and whether the result is any good. Wiz does the execution: the fetching, the cleaning, the code, the deploys. And once a site is live, it refreshes itself every day without me pressing anything.
One honest note before the tour: all six sites are in Polish. They were built for people here, about places here. I still think the point travels, and further down I'll show how you could do the same with your own country's data.
Four sites, four piles of public data
mieszkania.jock.pl: what developers want for a square meter
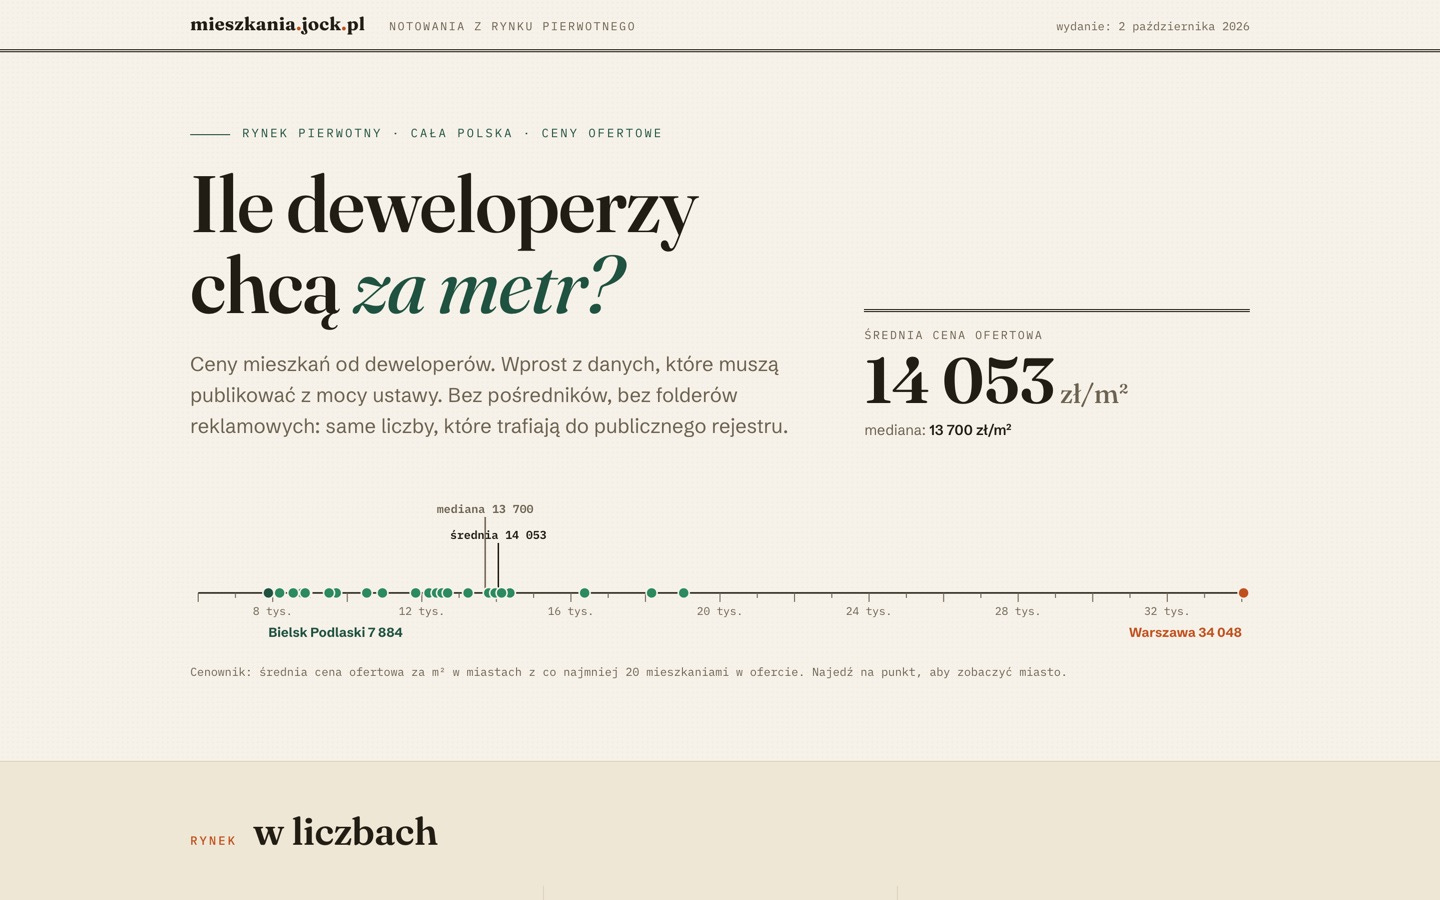
Since July 2025, Polish law (article 19b of the developer act) has forced housing developers to publish their asking prices as open files on dane.gov.pl, the government's open data portal. Great law. Thousands of price-list files in one register, and almost nothing showing them in a way a normal person could use.
When I checked on October 2: median asking price 13,700 PLN per m², 3,658 apartments from 95 developers in 70 cities and towns. Warsaw averages 34,048 PLN/m². The cheapest is Bielsk Podlaski at 7,884.
The second source is GUS, Poland's statistics office, with transaction prices for all 380 counties. One rule the site keeps: an asking price and a transaction price never sit in the same sentence. They come from different registers and different years, and mixing them is how you end up with a scary headline that isn't true.
smog.jock.pl: a ranking instead of a map
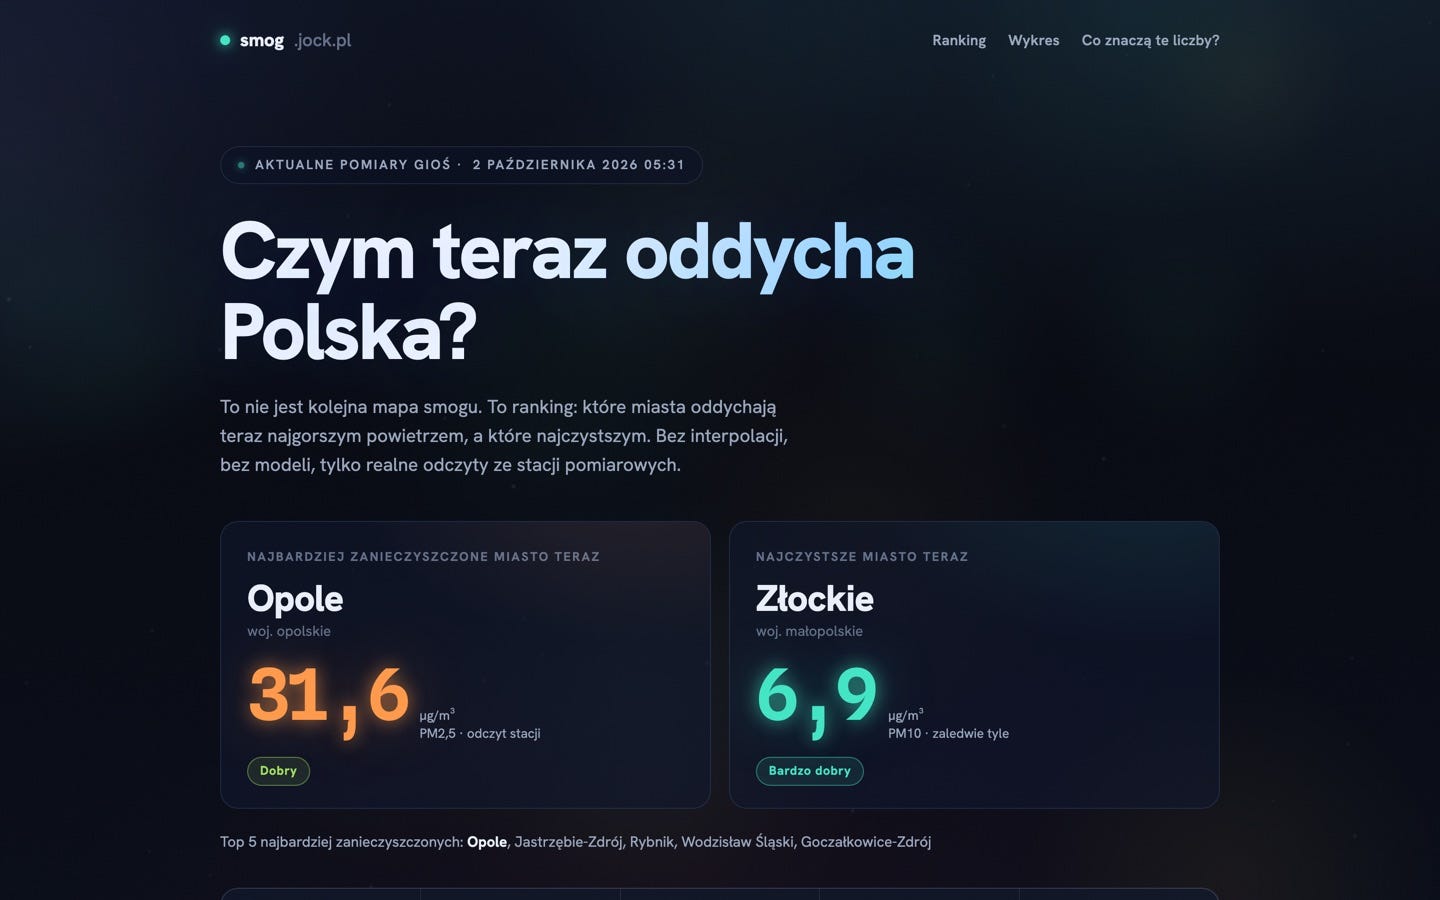
Poland has plenty of smog maps. I wanted a list. smog ranks 145 cities using 205 stations run by GIOŚ, the Chief Inspectorate of Environmental Protection, worst city at the top.
On the day I'm writing this, Opole leads with 31.6 µg/m³ of PM2.5. The Polish index still calls that "good". The WHO daily guideline is 15.
dane.jock.pl: 21 years of regional Poland
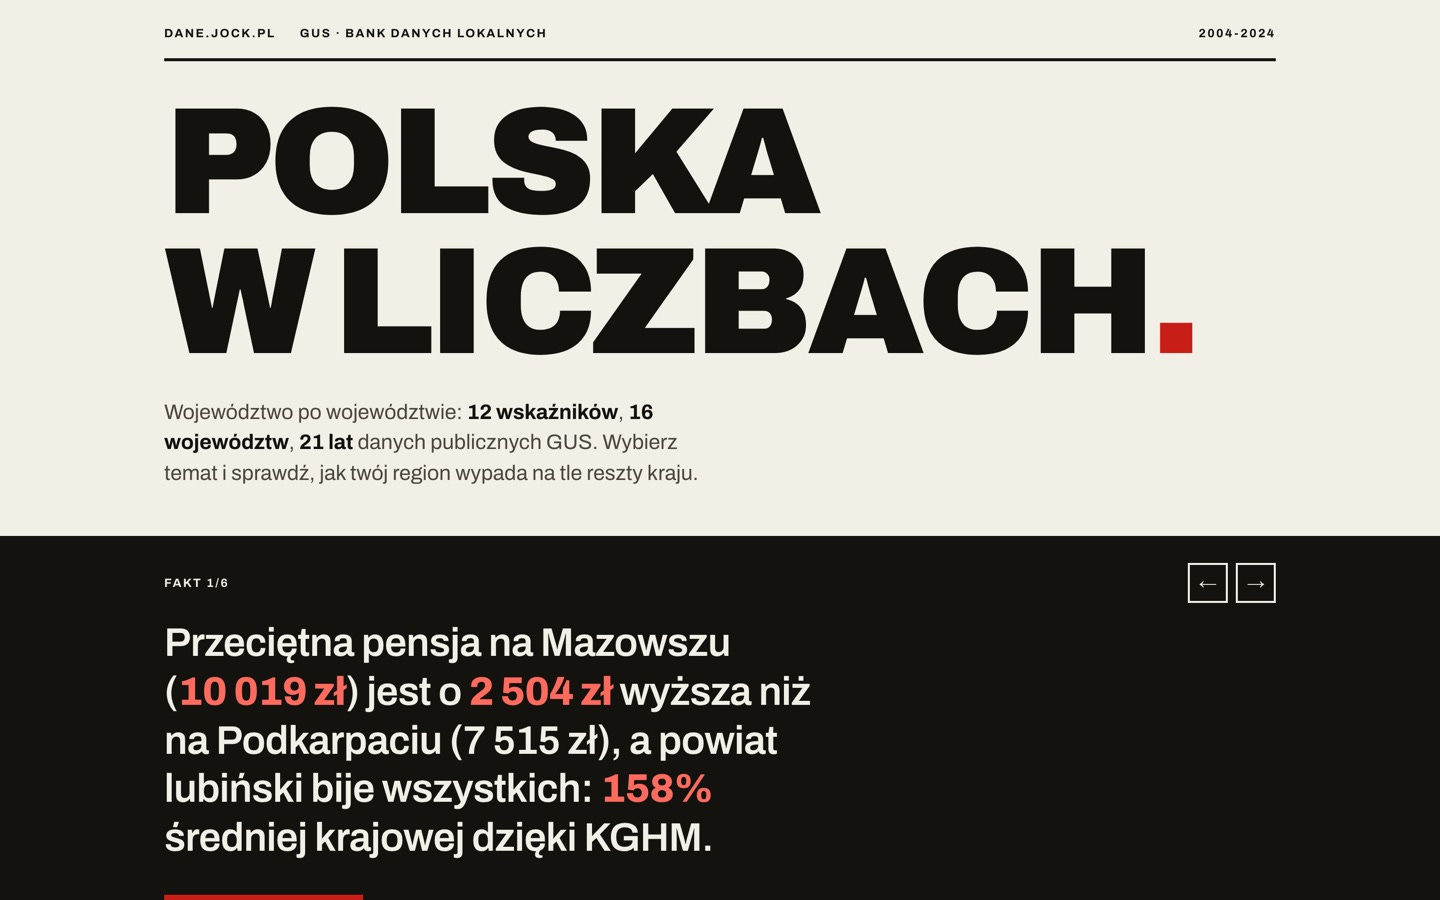
This one reads the GUS Local Data Bank: 12 indicators for all 16 voivodeships (our regions), from 2004 to 2024. It's the quietest of the six.
Some numbers from the page. Average gross salary in Mazowieckie, the Warsaw region, is 10,019 PLN. In Podkarpackie it's 7,515. Unemployment in Lubuskie fell from 25.6% in 2004 to 4.5% in 2024. And no voivodeship has more births than deaths anymore. Not a single one.
przetargi.jock.pl: who wins public money
Every larger public tender in the EU gets announced in TED, the EU's procurement journal. przetargi takes the Polish award notices and shows who won what.
In the two weeks up to October 2: 1,968 award notices worth 17.18 billion PLN. The biggest single contract, 4.24 billion PLN, came from PKP Polish Railway Lines, for a stretch of Rail Baltica in the northeast.

Odkrycia: where the datasets meet
Each of those four reads one source. The fifth, odkrycia.jock.pl ("discoveries"), reads all of them at once, and that's where it got interesting for me.
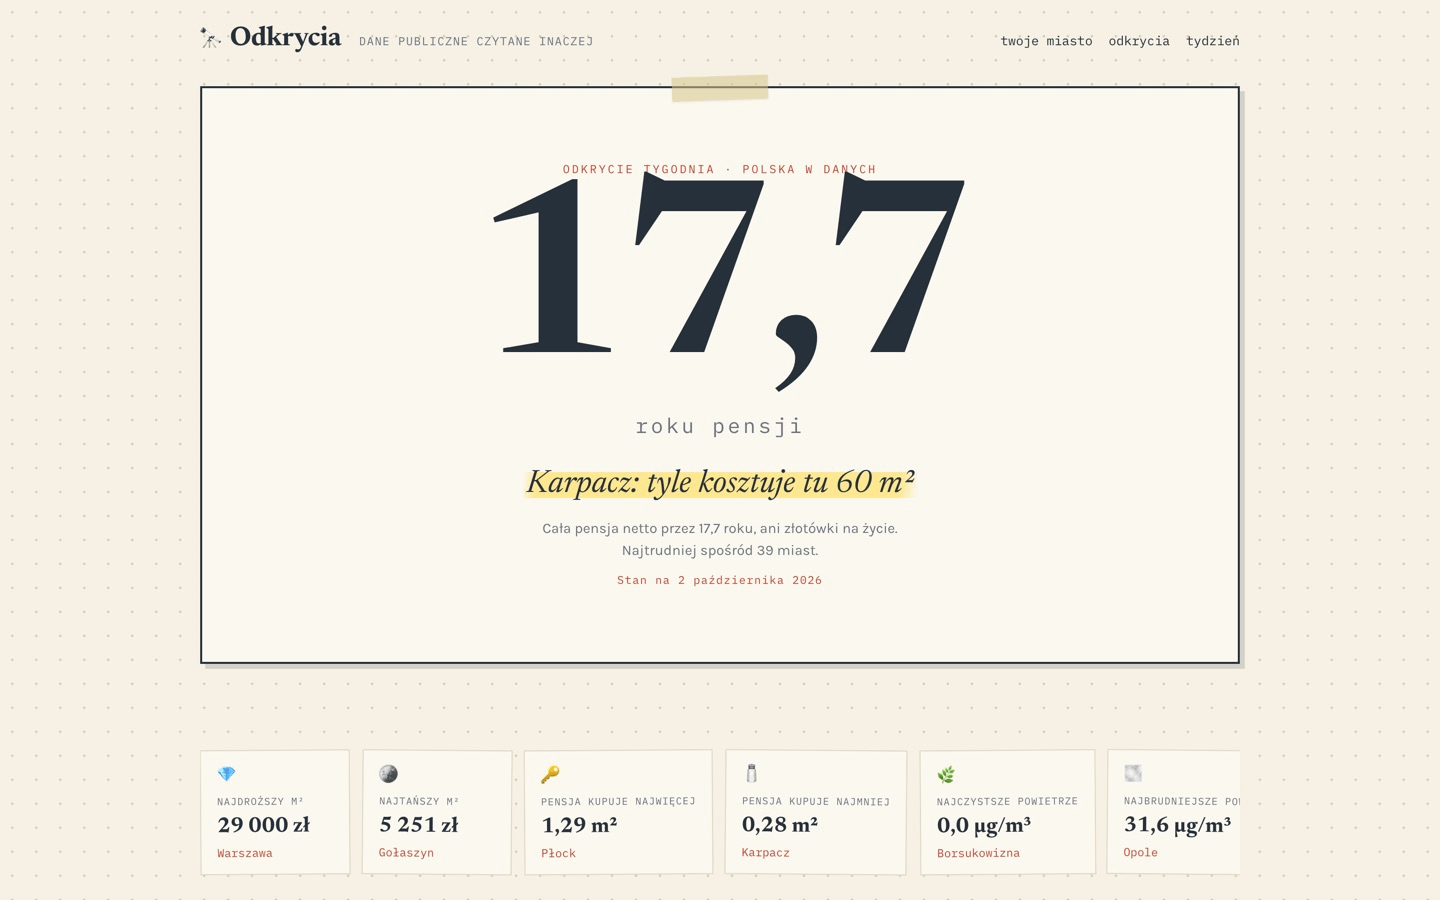
It joins four datasets for 39 cities: developer asking prices, GUS salaries and unemployment, GIOŚ air quality, and TED tenders. Then it squeezes the housing part into one number you can feel: how many square meters of apartment one net monthly salary buys.
On October 2, Płock came out on top at 1.29 m² per salary. A 60 m² flat there costs 3.9 years of full salary, if you spent nothing on anything else for those years. At the bottom was Karpacz with 0.28 m². Karpacz is a small mountain resort town, so my guess is holiday apartments priced for buyers who don't earn local wages. That's a guess. The data doesn't say why.
The site is upfront about its shortcuts. Net salary is estimated as 72% of gross. Salaries are county averages, while prices come from developers inside the city. Rough, and labeled as rough.
What I like here: neither dataset can produce that number alone. The developer register knows nothing about wages. GUS knows nothing about what a developer is asking in Płock this month. The square-meters-per-salary figure only exists after the join, and to someone deciding where to live it says more than either source does on its own.
Pogody: the site that distrusts its own sensors
Back to the lockers.
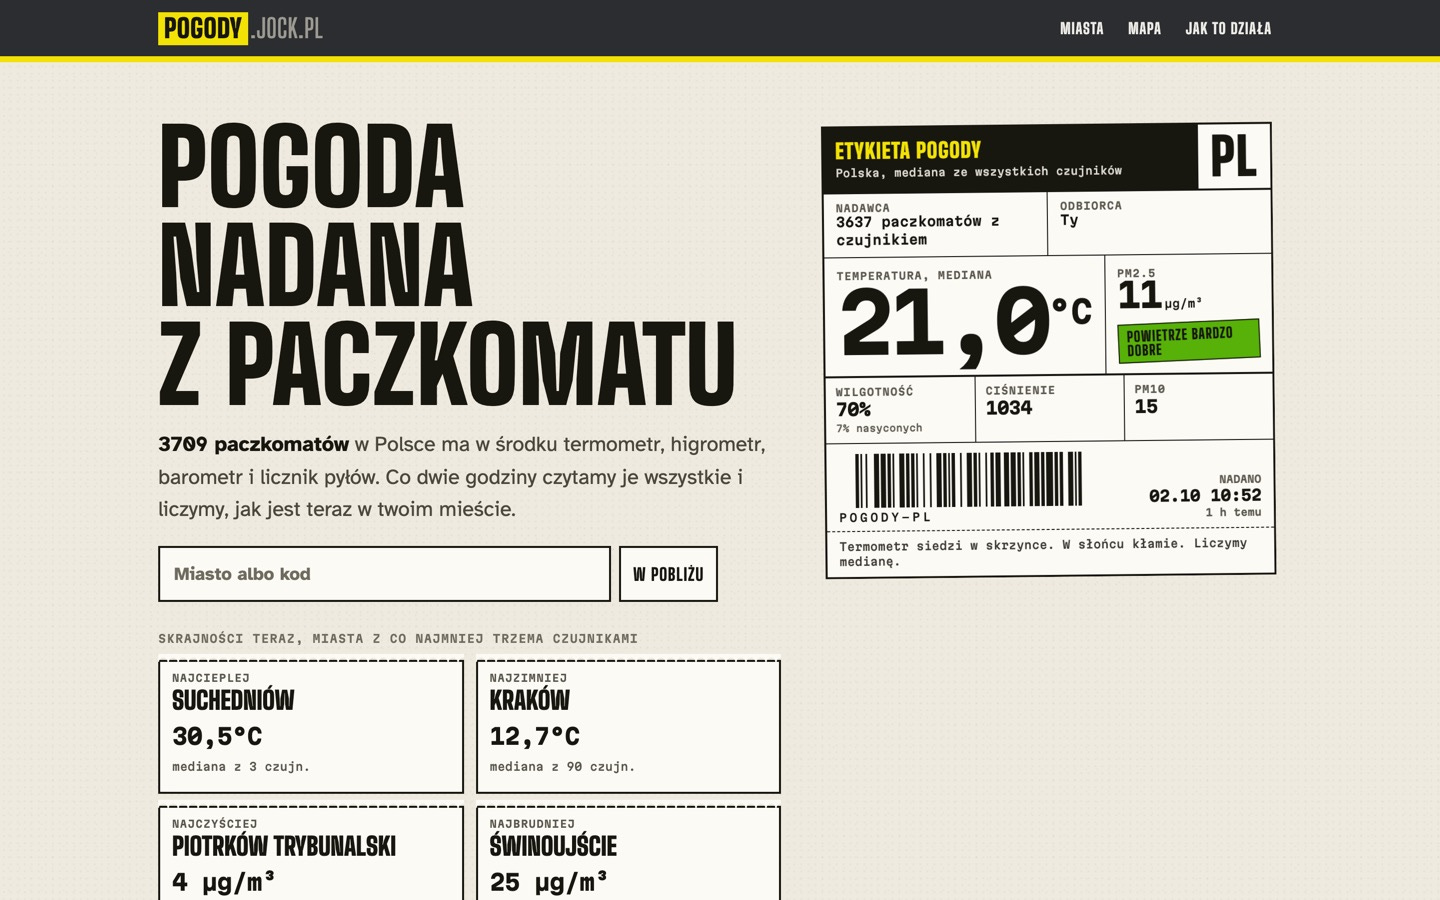
InPost started putting air sensors on its lockers back in 2021, and the readings show up in their app. Today 3,709 lockers carry a thermometer, a hygrometer, a barometer and a particulate counter. pogody reads them every two hours and builds pages for 140 cities. The design concept was "weather shipped from a parcel locker", so the hero looks like a parcel label and the city chart looks like a wall of locker doors.
Jakub is credited in the footer. So is air-locker-map, an existing map of the same sensors built for power users. That map was there first. pogody's angle is cities and plain language: what's the weather in my town right now, in one sentence.
The part I find most interesting is how much of the work went into distrust. Sensor data lies. A thermometer inside a metal box in the sun reads 30°C while the street is at 12. My bar was simple: a city number people can trust at a glance. Wiz turned that bar into rules:
A city's value is a median, so a few cooked boxes can't drag it up.
A locker more than 5°C warmer than its neighbors within 15 km loses its temperature and humidity.
Readings that haven't moved for 6 hours count as frozen and get dropped.
PM2.5 higher than PM10 is impossible (PM10 includes PM2.5), so it's treated as an error.
Newer sensors report pressure at their own height, older ones report it converted to sea level. Wiz converts the new ones using terrain elevation, and after that both types agree, around 1032 hPa side by side.
The site has its own one-liner for this: "The thermometer sits in a box. In the sun it lies. We count the median." On launch day the coldest city was Kraków, 12.7°C, a median of 90 sensors.
This is the same instinct I want from AI models. I once gave 16 models a search button and asked who the king of Norway is. Five named a dead man. A box in the sun and a model's memory share a problem: both come out looking confident. The useful work is deciding when to stop believing them.
What actually got cheap
None of this data is secret. Developer price lists, GIOŚ stations, GUS tables, TED, even the locker sensors. All public, some of it for years.
What was missing were the hours. Downloading 95 developers' files in whatever format each one picked. Handling the fact that Płock is a city with county rights and also the seat of a separate rural county, so a careless join hands you the wrong salary. Writing sanity rules for a thermometer in a box. Then building a page a normal person can read, and keeping it fresh every single day.
For one person with a full-time job and a kid, that's months of evenings per site. Realistically it would never happen.
Imagine if I had to do all of this on my own. The pressure conversion. The 5°C neighbor rule. The Polish grammar for 140 city pages. Each one is learnable, and each one costs an evening I don't have. With an agent carrying that part, my time goes to the parts only I can do: spotting that a LinkedIn post about lockers is really a weather map, deciding it should be about cities and not another national heatmap, asking for a design that stands apart from every dashboard built on the same data.
AI collapsed that cost. And when the hours get cheap, the scarce part moves to the question: what happens if I cross these two?
That question still comes from people. Jakub found the lockers, without even looking for a project. I've seen what happens when an agent picks what to build with no direction: it builds boring things. Here the split was clean. Jakub noticed. I asked the question and set the direction. Wiz did the hours. Take any one of the three away and pogody doesn't exist.
It's the same pattern as the health sites I wrote about recently, where an agent did the checking so a pile of messy claims could become a page you can actually read.
I'm also not saying everyone should go build websites now. I wrote that building your own things is cool too, and I mean it as an invitation. Some of these six will probably fade, and that's fine as well. The habit I'd take from this is smaller. When you see a pile of public data, ask what it would say next to another pile.
Doing this with your own country's data
Like, here's roughly how I'd start if I lived somewhere else.
Find a dataset a law forces someone to publish. Mandated data arrives on a schedule and in a format, because someone has to comply. The Polish developer prices exist because of one article in one act. Every EU country's larger public tenders sit in TED, so a przetargi for Spain or Ireland could exist tomorrow.
Check for an API before anyone scrapes anything. GIOŚ has one, TED has one, dane.gov.pl has one. Scrapers break quietly. APIs mostly don't.
Bring the question, let the agent build the boring pipeline. You decide what the page is for and who it's for. The agent does fetch, clean, one static page, a daily refresh. A prompt like the one below is enough to start.
Write down what you distrust. Every source has its own thermometer in the sun. Ask the agent to log every row it drops and why, then read that log once. It teaches you more about the data than the chart does.
Cross it with a second dataset, and find a unit a person can feel. Prices alone are a table. Prices divided by local salary is something you'd tell a friend.
Every day, download the latest [dataset] from [URL or API].
Clean it into one table: place, value, unit, date, source.
Log every row you drop and the reason.
Build one static page that ranks the places and shows
the source and date under every number.
Then find a second public dataset for the same places and
propose three ways to combine them into one number
a normal person understands.
Noticing is the job now
I keep thinking about how this one started. Jakub had nothing to build. He found out the boxes on the street were measuring more than parcels, said so in public, and a day later there was a weather site for 140 cities.
There are probably a few things like that within walking distance of you, quietly reporting to an app or a register that almost no one reads. Noticing them is the job now. The hours stopped being the hard part.
Thanks, Jakub.